
Documentation — Logistics Barycenter Calculation (SaaS Tool) #
Purpose of the Logistics Barycenter Tool #
The Logistics Barycenter Tool calculates the optimal point (or optimal zone) to minimize distances and travel times between multiple addresses (customers, warehouses, delivery sites). It uses a weighted calculation: each address can be assigned a weight (volume, number of parcels, revenue, frequency…).
SaaS version: accessible from your client dashboard → Barycenter App.
Getting Started — Step-by-step Logistics Barycenter Calculation #
- Access the app: My Account → Barycenter App.
- Add your addresses: click on the map or type manually (automatic geocoding).
- Assign a weight: weekly volume, number of deliveries, revenue…
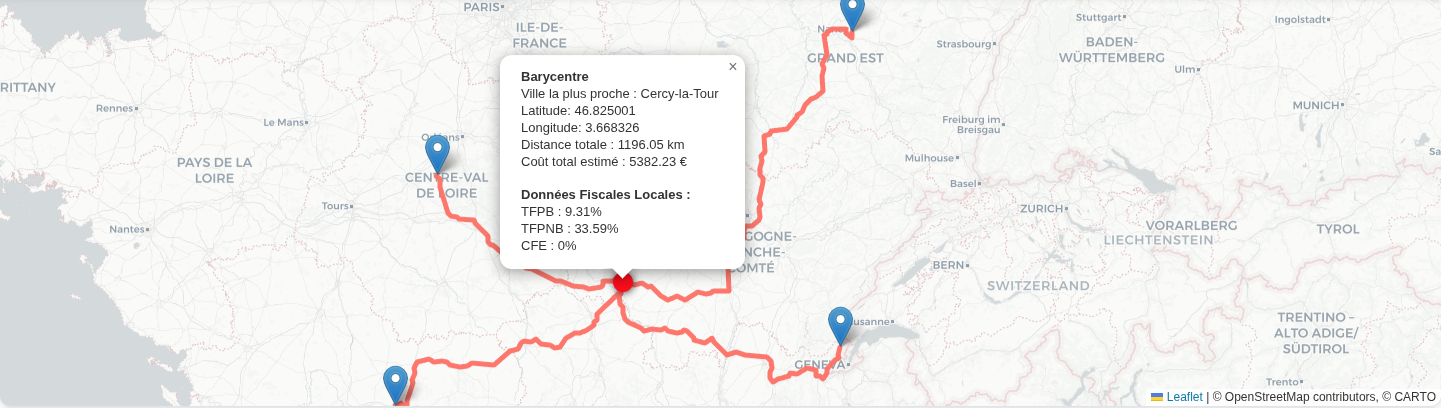
- Run the calculation: the tool computes the weighted barycenter and maps road routes to each point.
- Adjust: modify weights, move or enable/disable points.
- Export: CSV (default), PDF (if enabled), or save your projects.
Concrete Logistics Example #
You have 5 customers around Lyon, including one major client in Villefranche (50 deliveries per week).
The other customers each receive 10 deliveries.
The barycenter will naturally be closer to Villefranche, as that point carries more weight.
Tool Parameters and Advanced Options #
Default Center and Zoom #
Who is it for? Administrators or users who want the map to open directly on their area of activity (e.g. Paris rather than all of France).
How to use it? Set the default center (latitude/longitude) and zoom level (e.g. zoom = 6 for regional level, zoom = 12 for city level).
Maximum Number of Points #
Who is it for? Users who want to control performance and limit input (e.g. prevent 200 points from slowing down the calculation).
How to use it? Set a limit (e.g. 50) to balance speed and accuracy.
Clusters (Point Grouping) #
Who is it for? Logistics managers with many addresses (e.g. 80 customers in the same area).
How to use it? Enable clusters to visually group nearby points. When zooming in, clusters split into individual points.
Highlight Color #
Who is it for? Users who want to quickly identify the link between the table and the map.
How to use it? Click a row in the table (e.g. Customer X) and the corresponding point lights up on the map.
Lead Capture Modal #
Who is it for? Companies using the tool as a public showcase who want to collect leads.
How to use it? Set a delay (e.g. 30 seconds). After that delay, a pop-up appears inviting the user to leave their contact details.
Exports (CSV / PDF / History) #
Who is it for? Logistics and sales managers who want to keep a record and share their analyses.
How to use it? Click “Export” and choose:
- CSV to use the data in Excel or an ERP,
- PDF to generate a visual report,
- History to reload a saved project (depending on your plan).
Best Practices to Optimize Your Calculations #
- Enter complete addresses (number + street + postcode + city).
- Weight your points using a consistent unit (volume, revenue…).
- Place your points on the road or roadside to avoid straight-line routing.
- Choose the right profile: car (logistics), bike (urban), pedestrian (testing).
Understanding the Logistics Barycenter #
The barycenter is a weighted mathematical point that globally minimizes distances or travel times. The tool then projects it onto the road network via the API to provide a realistic result.
- Choose the optimal location for a new warehouse.
- Compare multiple candidate sites.
- Balance delivery routes.
Exporting and Sharing Results #
- CSV: list of addresses, weights, distances/times, barycenter.
- PDF (if enabled): map + summary table + assumptions.
- History / Projects: available depending on your plan.
Tool Limitations #
- Recommended number of points: up to 50 for instant calculation, slower beyond that.
- Road data based on OpenStreetMap: some recent or private roads may be missing.
- No real-time traffic: travel times are theoretical.
Useful Links #
👉 Visit the Pricing page to compare plans by number of points, exports and history.
👉 For any questions, visit the Contact page.
Tech & APIs Used #
| API | Role | Symptoms | Solutions |
|---|---|---|---|
| Geocoding | Address ↔ GPS coordinates | Ambiguous results, point placed in city center | Enter full address, correct manually |
| Snapping | Project a point onto the road | Point off-network, straight-line display | Move onto the road, widen radius |
| Routing | Real road itinerary | Straight line, “no route found” | Check profile, move point, avoid private areas |
| Matrix | Distance/time table | Error with too many points, null distances | Limit points, segment, prefer car profile |
| Isochrones | Area reachable in X min/km | Approximate outlines, empty zones | Check profile, use as indicator only |
| Quotas | Limit API consumption | Empty responses, 429 errors | Segment calculations, wait for quota reset |
Quick Troubleshooting #
- Straight line → move the point onto the road.
- “No route” message → try a different profile.
- “Null” value → point unreachable.
- Inconsistent routes → check the address.
- Repeated errors → quota reached.
FAQ — Frequently Asked Questions #
Is the barycenter always on a road? #
The raw calculation gives a theoretical point. The tool then projects it onto the road network.
Why do I sometimes see a straight line? #
The engine couldn’t find a route (point off-network, private access, unsuitable profile, quota reached).
Can I avoid motorways or tolls? #
Yes, if your configuration exposes these options. Otherwise, the calculation uses optimal routes.
How many points can I add? #
This depends on your plan and API limits.
Can I import addresses from an Excel or CSV file? #
This feature is not yet available. An import option is planned for a future version.
How accurate are the travel times? #
Times are based on OpenStreetMap. They do not account for real-time traffic.
Can I use a profile other than car? #
Yes, bike or pedestrian are available, but car is the most suitable for logistics.


